Chapter III – Practical studies
Mode of travel: 146
We then examined the number of car and motor cycle registrations in Newbury and district, and arrived at a ratio of cars per 1,000 persons for each of the various residential zones
Mode of travel
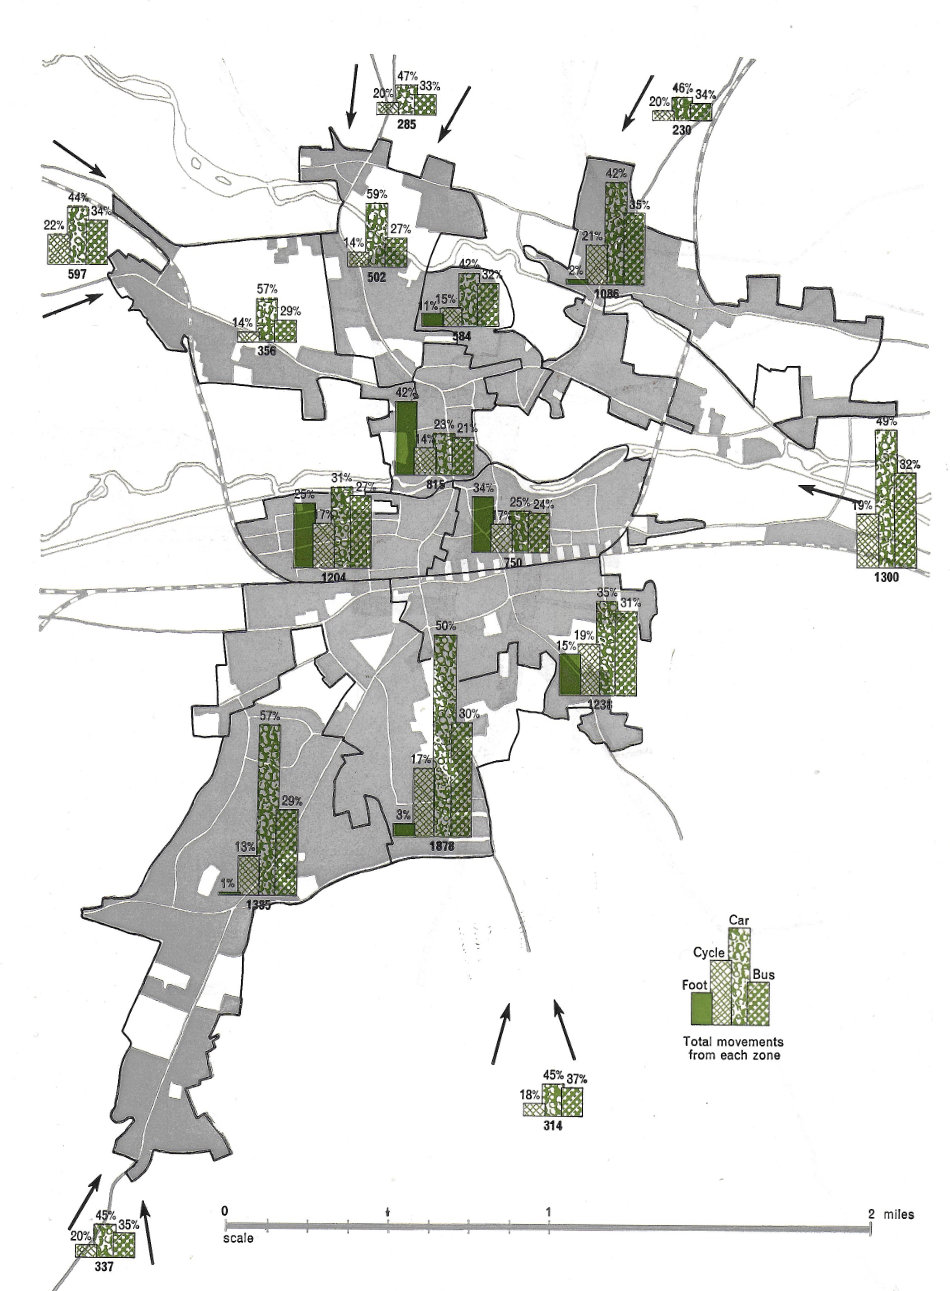
146Thus far we had obtained a picture of movements, but without regard to the means or ‘mode’ of travel nor the period over which they take place. From an examination of the variation in present-day flows, it was apparent that the majority of the work-to-home journeys took place during the period from 5 p.m. to 6 p.m., with a distinct peak between 5.00 and 5.15 p.m. We then examined the number of car and motor cycle registrations in Newbury and district, and arrived at a ratio of cars per 1,000 persons for each of the various residential zones, the ratios being adjusted in accordance with the distribution of the income groups. We also examined the availability of public transport in various localities, and the position of the residential zones in relation to the employment zones. In this way we were able to make an estimate of the manner in which the various work-journey movements would be apportioned between buses, private cars and motor cycles, pedal cycles, and pedestrians. Figure 74 shows the estimated proportion of workers travelling by each of the various modes of travel from each residential zone