Chapter III – Practical studies
Peak hour flows: 147
The peak hour is that period of one hour during the 24-hour day in which more traffic is carried than in any other hour
-
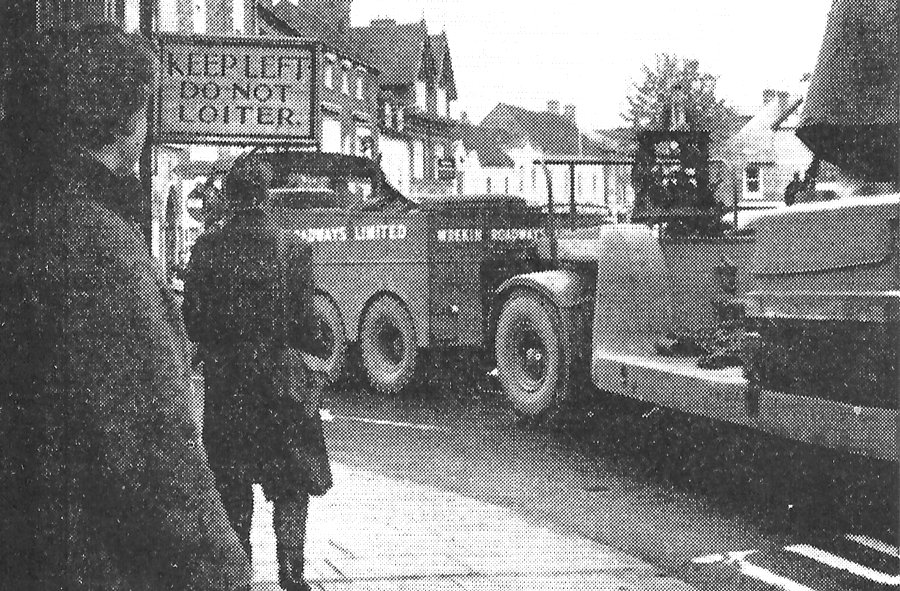
Fig.68 Heavy through traffic in the town centre. -
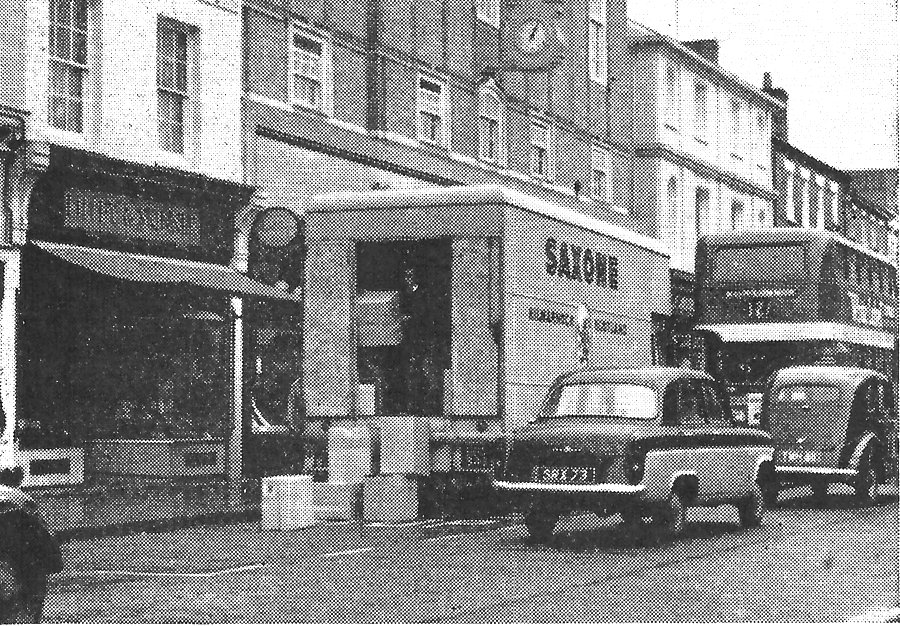
Fig.69 Northbrook Street-lack of unloading facilities adds to the problem. -
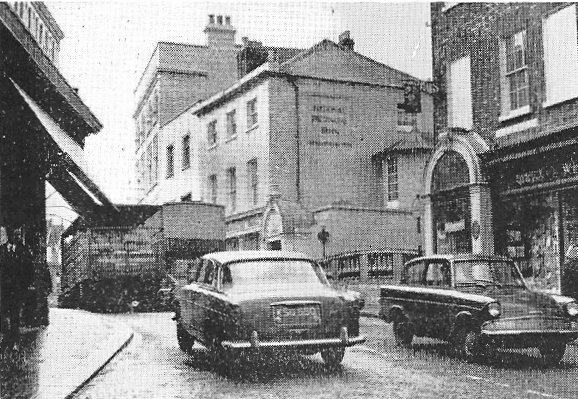
Fig.70 The narrow bridge over the River Kennet at the southern end of Northbrook Street. This is part of a trunk route for long distance traffic.
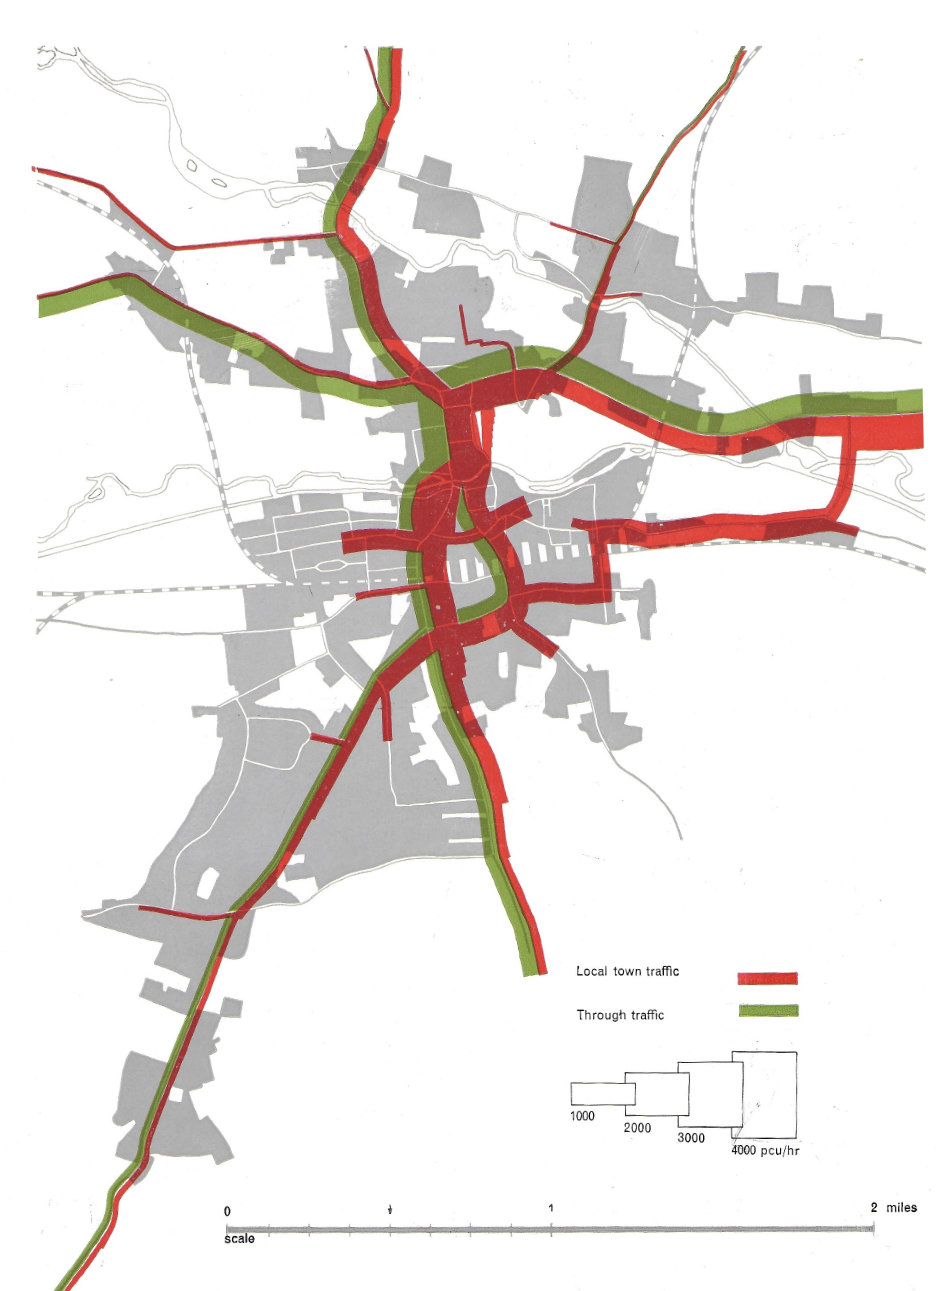
Peak hour flows
147A hypothetical picture could then be drawn of the flow of vehicles along the existing main road system for a normal weekday at the peak hour. The peak hour is that period of one hour during the 24-hour day in which more traffic is carried than in any other hour. We had worked out the figures for the work-journeys which we knew would be dominant in the 24-hour picture. By assigning each group of movements to the most likely route between the various origins and destinations, we were able by a process of summation, wherever such movements coincided, to determine the probable volume of work-journey traffic on each section of road. An assumption was made that the additional traffic consisting of commercial vehicles, buses, and cars used for other non-work journeys, would amount to roughly 10–25% of the work-journey flows, depending on the character of the route. In and around the town centre, where shopping and commercial traffic is particularly important, we refined the calculations for commercial traffic by using a traffic generation factor of the number of vehicles per 1,000 sq. ft. of floor area, the factor varying for different types of land use. We also found that detailed figures were available from a recent survey of through traffic. Putting all this information together we secured the picture of peak hour flows represented in Figure 75. We checked the total flows by means of a number of actual spot counts, and made any necessary adjustments. A few such adjustments were necessary, but generally the estimated flows were sufficiently close to the actual flows to indicate that the method of analysis was sound, and that the assumption as to the period over which the majority of journeys took place was correct.